July is a pivotal month for most imaging dealers. The first half of the year is behind you, Q4 still feels a long way off, and the daily demands of running a dealership make it easy to postpone asking an important question:
Are we on pace to hit our profit goals?
The dealers who finish the year strong are rarely the ones who get lucky in Q4. They are the ones who take an honest look at their numbers mid-year, identify where profit is slipping away, and make targeted adjustments while there is still enough time for those changes to make a difference.
With half the year already behind you, now is the time to determine whether your dealership is on track and where opportunities for improvement still exist.
Below are seven metrics worth reviewing before Q3 ends.
Metric 1: Cost Per Copy (CPC) vs. Contract Rate
Service contracts are often one of the largest contributors to long-term profitability in an imaging dealership. When the cost of servicing an account begins to outpace what you’re billing, margins shrink, and profitability suffers.
One of the best ways to uncover these issues is by reviewing cost per copy (CPC) against contracted rates.
If you haven’t looked closely at service profitability lately, review your cost per copy by device category and compare it to your contracted rates. Black-and-white and color should be analyzed separately since color devices carry both higher supply costs and greater margin potential. In a healthy portfolio, your blended service costs should leave you with a minimum 50% to 55% Service Gross Profit (SGP) margin across your contract base.
Common problem areas include:
- Aging equipment with declining yields
- Low-volume accounts with disproportionately high service costs
- Color output running on contracts priced too close to monochrome rates
- Legacy agreements that have not been reviewed in years
The sooner these issues are identified, the more options you have to address them. In many cases, a mid-year review can reveal opportunities to adjust pricing, improve contract profitability, or proactively address accounts that may be eroding margins.
Metric 2: First Call Effectiveness (FCE)
First Call Effectiveness measures the percentage of service calls resolved during the technician’s first visit. Few service metrics affect both profitability and customer satisfaction as directly.
Every additional visit increases labor costs, fuel expenses, scheduling complexity, and customer frustration.
Rather than focusing on a specific benchmark, focus on your trend line. Is FCE improving, remaining steady, or moving in the wrong direction?
If performance has stalled or declined, investigate the root cause. Common contributors include:
- Technicians arriving without the necessary parts
- Limited pre-call diagnostics
- Training gaps on specific product lines
- Territory designs that make inventory management difficult
Even modest improvements can have a meaningful impact. Fewer repeat visits create capacity, reduce costs, and improve the customer experience.
Metric 3: Technician Utilization and Calls Per Day
Labor remains one of the largest expenses in a service department, which makes technician productivity a key driver of profitability.
Two metrics deserve close attention:
- Technician utilization
- Calls completed per day
The goal is not simply to maximize activity. It is to ensure technician time is being spent on productive work that contributes to customer satisfaction and service profitability.
When productivity falls below expectations, the issue is often one of three things:
- Territories that cover too much ground
- Inefficient dispatching and scheduling
- Excessive downtime between calls
Travel time deserves special attention. A technician who spends a significant portion of the day behind the wheel is not spending that time serving customers.
In many cases, territory adjustments and route optimization can improve productivity without adding headcount.
Metric 4: Sales Rep Productivity and Pipeline Velocity
Sales productivity is rarely about effort. Most sales reps are busy.
The more important question is whether their activity is producing the results needed to reach annual targets.
At the midpoint of the year, review three key measures for every rep:
- Year to Date quota achievement against Net New and MIF quotas
- Active pipeline value (5X quota for the next 3 months, and 10X quota for the remaining 6 months).
- Proposal-to-close conversion rate
The conversion rate often reveals the most useful insights.
A rep carrying a large pipeline with a low close rate has a very different challenge than a rep carrying a smaller pipeline with a high close rate. Each situation requires a different coaching approach.
Pipeline velocity is equally important. Opportunities that sit in the pipeline for months without movement may indicate issues with qualification, follow-up, proposal strategy, or customer engagement.
Slow-moving opportunities are often process problems, not forecasting problems.
Metric 5: Gross Profit by Revenue Category
Overall gross profit percentage provides a useful snapshot, but it rarely tells the whole story.
Equipment sales, service contracts, supplies, managed services, and professional services each have distinct margin profiles. Changes in revenue mix can significantly impact profitability even when total revenue is growing.
By mid-year, compare gross profit performance across each revenue category against both prior-year performance and current targets.
Pay particular attention to recurring revenue streams and service-related revenue, which often contribute disproportionately to long-term profitability.
Also, ask this question:
Are we growing revenue and gross profit in our largest revenue categories? (particularly in service where A/4 is taking a bite out of former A/3 revenues}
A dealership that grows equipment revenue faster than service revenue may report top-line growth while seeing profitability decline.
Metric 6: Contract Renewal Rate and At-Risk Account Identification
Recurring revenue is what makes an imaging dealership predictable.
When contracts are lost, the impact goes beyond revenue. You also lose the gross profit tied to those accounts and incur the cost of acquiring replacement business.
A mid-year review should include every contract scheduled to renew during Q3 and Q4, ranked by annual contract value.
For each account, assess:
- Recent service history
- Customer satisfaction trends
- Competitive pressure
- Organizational or budget changes
A contract retained in August is generally more profitable than a new contract won in November because it carries no acquisition cost.
Proactive conversations with at-risk accounts are among the highest-return activities leadership teams can prioritize during the second half of the year.
Metric 7: EBITDA Margin vs. Full-Year Target
Every metric discussed above ultimately leads to one number: EBITDA.
EBITDA (Earnings Before Interest, Taxes, Depreciation, and Amortization) is one of the clearest measures of overall business profitability.
At mid-year, your trailing six-month EBITDA margin provides one of the clearest indicators of where you are likely to finish the year.
If performance is on target, the focus should be on maintaining momentum.
If performance is lagging, dig deeper to identify exactly what is driving the gap. Without that level of detail, corrective actions become educated guesses.
If there is a significant gap between where you are and where you expected to be, now is the time to understand why.
Mid-Year Performance Snapshot
As you review the first half of the year, these are the questions every dealership leadership team should be asking:
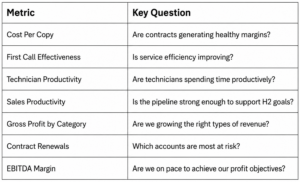
Asking these questions is a good first step. The next challenge is determining what to do with the answers.
Translating the Numbers Into H2 Action
Reviewing these metrics without connecting them to action is only half the exercise.
Once the data is in front of you, ask three questions for every area that falls short of expectations.
What is causing the gap?
Be specific.
“Service costs are high” is not an answer.
“FCE has declined because technicians are spending more time on aging equipment that requires repeat visits” is an answer.
What can realistically change before year-end?
Not every problem has a quick fix, but many do.
Contract repricing, territory adjustments, inventory improvements, and pipeline coaching can often produce measurable results within 60 to 90 days.
Who owns the solution?
Action items without ownership rarely gain traction.
Assign responsibility, establish measurable goals, and define timelines.
The dealerships that execute successful second-half recoveries are usually the ones that make accountability visible.
Your annual targets do not change because the first half was challenging. The opportunity to influence the outcome, however, becomes smaller with each passing week.
A focused mid-year review, combined with a clear plan for the second half, can make the difference between falling short and finishing strong.
See Where Your Dealership Stands
Pros Elite Group works with imaging dealers across North America to help uncover profitability opportunities, benchmark performance, and identify practical ways to improve results.
The challenge for many dealerships isn’t a lack of data. It’s having the visibility to understand what that data is saying. Metrics such as service profitability, contract performance, technician productivity, and sales pipeline health often span multiple systems, making it difficult to see the complete picture.
That’s where PIVOT provides clarity. PIVOT Analytics brings key dealership metrics together in a single platform, giving leadership teams greater visibility into performance trends, profitability drivers, and areas that may require attention before they impact the bottom line.
If you want to better understand where your dealership stands and where opportunities may exist, we would welcome the conversation.
Try our profitability calculator to estimate your profit opportunity or schedule a PIVOT demo to see how your dealership data can be transformed into actionable insights.
Frequently Asked Questions
How often should a dealership review these metrics?
Operational metrics such as FCE and technician productivity should be reviewed monthly. Gross profit, contract performance, and EBITDA trends typically warrant a deeper quarterly review. The mid-year review is particularly important because it provides one of the last opportunities to make meaningful adjustments before year-end.
What is the most important profitability metric for a dealership?
There is no single metric that tells the whole story. EBITDA provides a high-level view of financial performance, but it is heavily influenced by service profitability, contract retention, sales productivity, and revenue mix. Looking at these metrics together provides a more complete picture.
What are the biggest warning signs that a dealership may miss its profit goals?
Declining service margins, rising service costs, slowing sales pipeline activity, increased contract churn, and shrinking EBITDA are all signs that profitability may be under pressure. Identifying these trends early gives leadership teams more time to make adjustments before year-end.
About Pros Elite
The Pros Elite Group is a trusted consulting and training organization that helps dealers improve service, sales, and overall business performance in the Hybrid Document Imaging Industry. With more than 90 years of combined leadership experience, the Pros Elite team helped create the industry’s benchmarking model that many dealers still use today to measure success.
Working with hundreds of clients across North America and beyond, Pros Elite continues to help businesses strengthen profitability, streamline operations, and achieve measurable, lasting growth.